PHP IntelliSense on the Web
Have you heard about the Visual Studio Code for the Web? It's the code editor running in your browser, allowing to work with your local files, files on your GitHub repositories, or files on Azure. Anywhere.
Have you heard about the Visual Studio Code for the Web? It's the code editor running in your browser, allowing to work with your local files, files on your GitHub repositories, or files on Azure. Anywhere.
When you develop applications that need to communicate with each other you might need to debug two or more projects at once. You can achieve this very easily with PHP Tools for VS.
Welcome to the third article of PHP on Docker. In the previous article, we learned how to create two connected containers with php and nginx with the help of Docker compose, and we also talked about different environments where your software needs to work.
In the previous article, we talked about Docker and created a simple Docker Image with PHP inside Visual Studio Code. If you did not read it yet, I strongly recommend reading it before, since you'll have more context for this one. In this article, we will create a multi-container application using PHP and Nginx with the help of Docker Compose. You can see all the files we will be creating on github.
The January 2022 update of PHP Tools for VS Code introduces code lenses and full support for PHP 8.1. Additionally we're adding other neat debugging improvements - debugging adornments with contextually appropriate inline values, quick debug configurations, and more.
I'm sure you have already heard something about it. Docker -the technology that completely took over the software world in the past few years. This article explains what Docker is and how to use it with PHP inside Visual Studio Code.
The PHP Tools for VS Code extension received a lot of neat updates and new features! Let's take a look on the new code-lens, debug improvements, improved code analysis, new tool tips, and more!
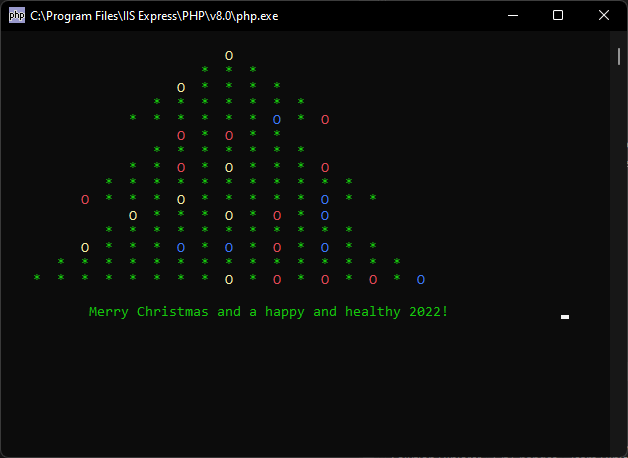
I received an mail from one developer using our tools - Mr. Bert Degenhart Drenth from Netherland, which I wanted to share with the rest. It's a Christmas wish in the form of PHP console program :-)
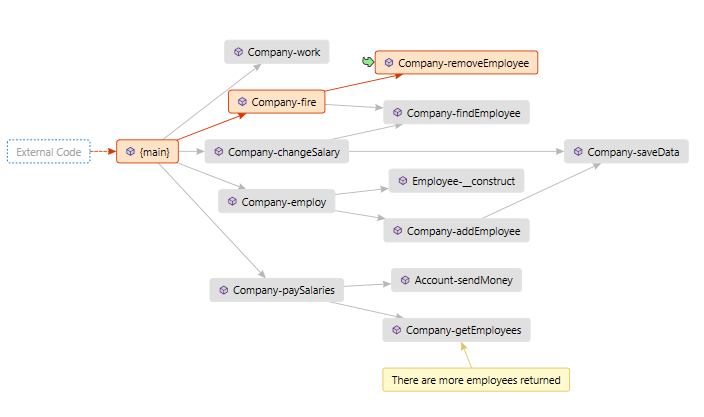
Important! You to have Visual Studio Enterprise for Code Maps to work.