Advanced Debugging Tips

The Visual Studio debugger is incredibly rich and knowing more than F5, F9, F10, F11 and Watch windows can save you lot of time. Finding an issue and simulating a particular state of the application can be achieved easily if we utilize the rich debugging features available out-of-the-box in Visual Studio. All these features are available for PHP developers using PHP Tools.
During debugging, people are often trying to reach a desired location in the source code by putting a breakpoint there or repeatedly using F10/F11 to step through their code until they reach the location. In some cases, it actually makes sense when they are observing each statement they step over along the way. Often, though, they are just trying to reach the location they care about. In that case, there's a better alternative.
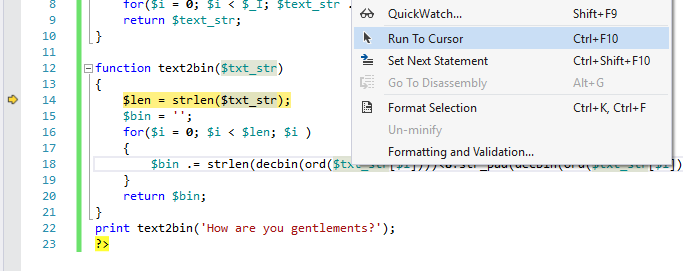
The "run to cursor" command is more convenient. When you position the cursor on the line of code you are trying to reach and press Ctrl+F10 the debugger will run the application to that line and break. That saves many F10/F11 keystrokes. You can even start the debugging session this way and it will break the application on the line you want.
Be careful to actually use it on a piece of code which is going to be executed. Watch out for early returns from a function within a loop, for instance.
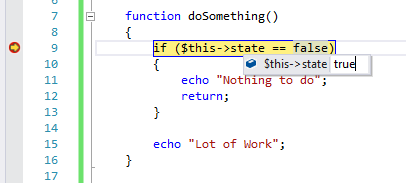
Visual Studio debugger isn't just a read-only analyzer of the application. We can actually alter values of the variables of the program during the debugging session to simulate a different state of the application.
Let's say you want to know if the function is going to work as expected, when some value is different. And in most cases, it does not mean changing the code and restarting. Just hover the mouse over a variable, double-click on the value and type in the new one.
Values can be changed also in Watch Windows
Supported since PHP Tools for Visual Studio 1.24.
Usually in different PHP specific IDEs, there are settings for breaking on the first statement when the debug session starts. We try to respect Visual Studio conventions, so just pressing F11 will start the debugger and break on the first statement. This will save time by searching through the application and placing a breakpoint there or when you are just not sure what is going to run first.
When debugging, we sometimes want to execute a particular function or expression to check the results we would get in the current context. For this purpose, we can use the Immediate Window that can be opened by pressing Ctrl+Alt+I or navigating ( Debug | Windows | Immediate ).
Let's say we want to find out how many characters the "Hello World" phrase has. We can call "strlen" from Immediate window to find out.
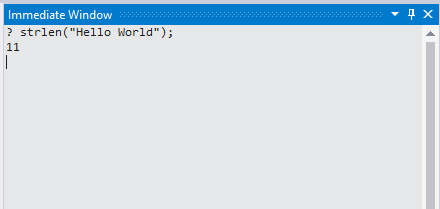
Obviously, you are not limited to built-in PHP function, you can call any user defined function or basically any kind of valid expression as well.
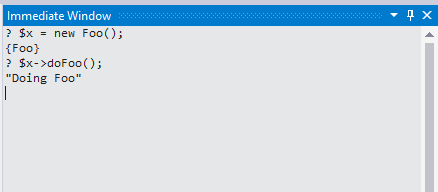
In case of methods, we need to initialize instance of the class first (or use already existing objects in the current context) and then call the method.
Let's say this is the class with a method we want to call:
class Foo{

    function doFoo()
    {
        return "Doing Foo";
    }
}
Note:
It's not required to preface the expression with a question mark (?) in Immediate Window. I'm using it in samples, because the question mark allows the expressions to be evaluated also in the Command window.
There are situations when we want to observe a value of the variable or expression each time a particular line of code is executed. Doing this by setting a breakpoint on the location and observing the value each time would be very time consuming. So, we usually alter the application and add echo to print the value which is not a good approach, either. In general, modifying a source code for the purpose of debugging isn't the most recommended approach as added modifications can change the program behavior or you can forget to remove the code when finished.
Instead we can use TracePoints. A tracepoint is a breakpoint with a custom action associated with it. When the tracepoint is hit, it causes the debugger to perform the specified action instead of (or in addition to) breaking the program execution. So, it can serve the same purpose as echo would without a need to modify the actual application.
First, we create a standard breakpoint by pressing F9. Then we have to hover the breakpoint sign and select the settings symbol. It will open a breakpoint settings dialog where we fill the log message into the Actions section.
Note:
In VS2013 and lower you would need to right click on the breakpoint (in the editor left margin or in the breakpoint window) and choose 'When Hit...'
The log message can contain text, as well as embedded placeholders for things like function and call-stack. Or we can use curly brackets when we want to include the value of a variable or other PHP expression in the message, such as "The value of $x is {$x}".
As an example, let's use the recursive factorial function. We want to see the result of each recursive call.
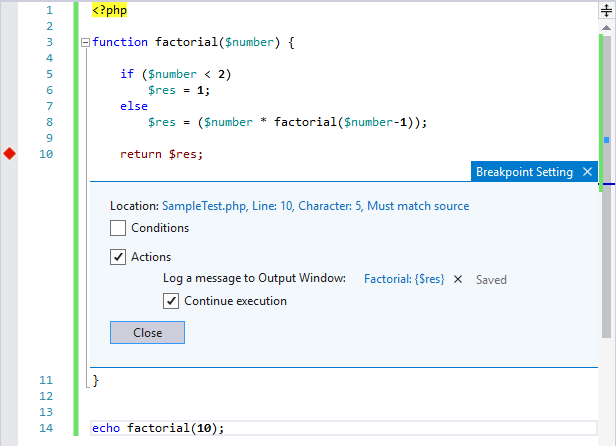
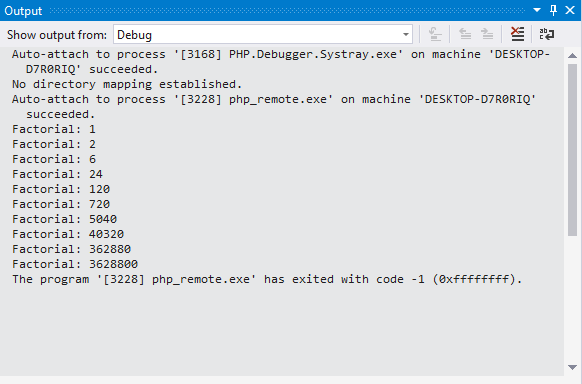
In our example we are using "Factorial: {$res}" as a log message. So after running the program we can see the factorial result for each recursive call in the Output Window.
When we need a breakpoint or a tracepoint to be hit only when certain conditions are true, we can use conditional breakpoints. Again, this will save us from having to write extra if/else conditions directly in our code or just stepping through the code until the condition is met.
In the following sample we are going to break when the variable $i == 100:
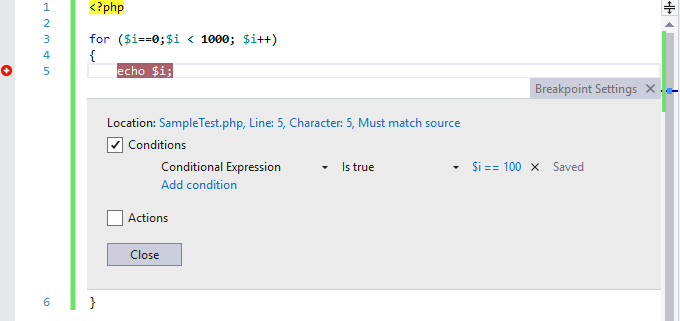
In a cycle like this, it's a real time saver as I wouldn't be pressing F5 100 times.
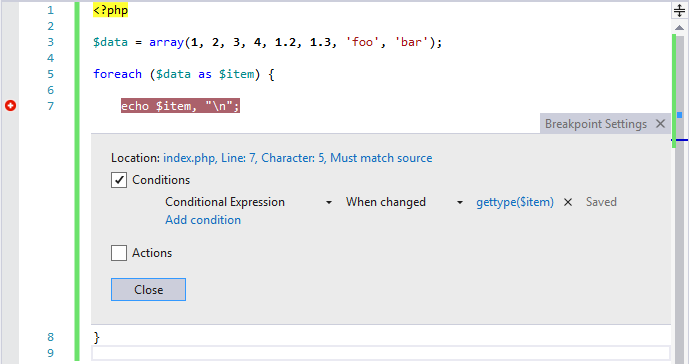
Conditional breakpoints also allow us to break when the value of the expression has changed, instead of breaking when the condition is true. This makes finding some tricky state issues much easier.
Let's say we want to break when the type of the variable changes. We would set a conditional breakpoint which breaks when gettype($item) has changed. This way we can examine the application behavior for each type.
Note:
The debugger does not evaluate the expression until the first time the breakpoint is reached. If you choose "when changed", the debugger does not consider the first evaluation of the condition to be a change, so the breakpoint will not be hit on the first evaluation.
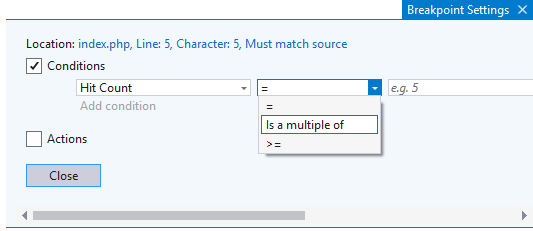
The hit count is the number of times the breakpoint has been hit. We can choose when we want to break at the breakpoint according to hit count. Here we may choose on which "hit count(s)" to break:
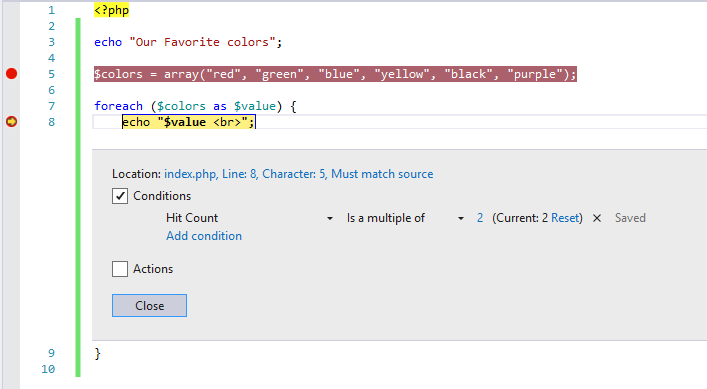
In the picture bellow, we are setting a breakpoint which is going to break each second time the location is reached. When the breakpoint is hit, we can see the current hit count which in this case is 2, or we can reset it to zero.
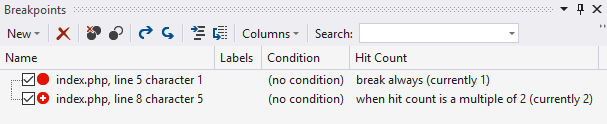
It's possible to examine how many times a breakpoint was hit even without a hit count condition. Just open the Breakpoints Pane by pressing Ctrl+Alt+B or navigation Debug | Windows | Breakpoints. Each breakpoint has a Hit Count column where you can find both hit count condition (or break always if a condition is not set) and the current hit count.
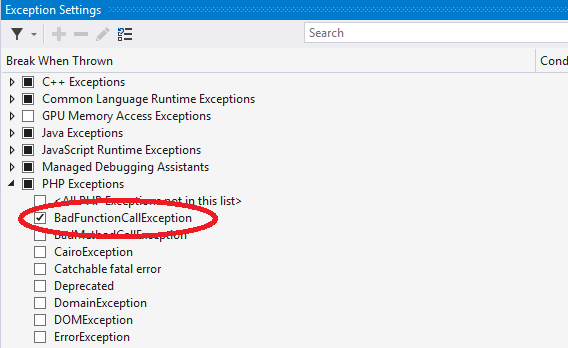
Sometimes we do not know in what particular location to break, we just want to break when an exception is thrown. We can specify to break on the exception. By default, PHP Tools for Visual Studio breaks when a fatal error occurs. A fatal error is an error which prevents the continuation of the script execution, e.g. parse error or unhandled exception.
For the next sample we are setting Visual Studio to break on BadFunctionCallException in the Exception Settings. To open Exception Settings press Ctrl+Alt+E (or navigate Debug | Windows | Exception Settings ).
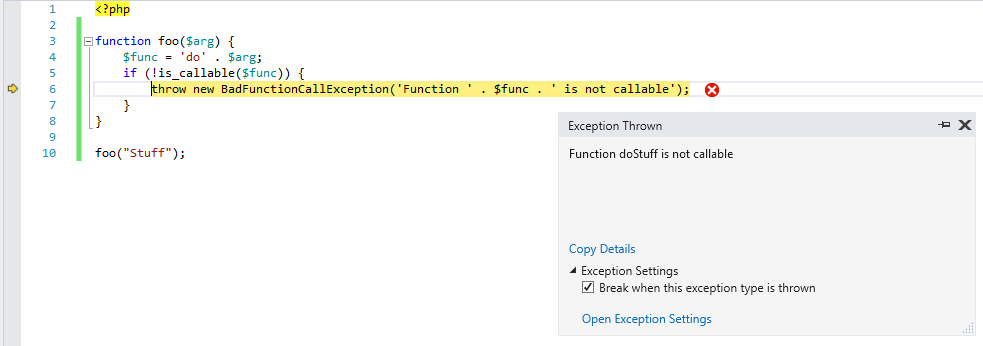
When we run the following code, the program stops when BadFunctionCallException exception is thrown.
I highly recommend spending some time learning all of these features. The above mentioned tips and tricks are less known, but they can be incredibly useful. Make sure to update to PHP Tools for Visual Studio 1.24 or higher, since many of the mentioned features are not available in previous versions.
I hope this article will help you in your next debug session!
Introduction to PHP on Docker on Visual Studio Code