Skip to content

tutorial#

Optimize Native Function Invocation

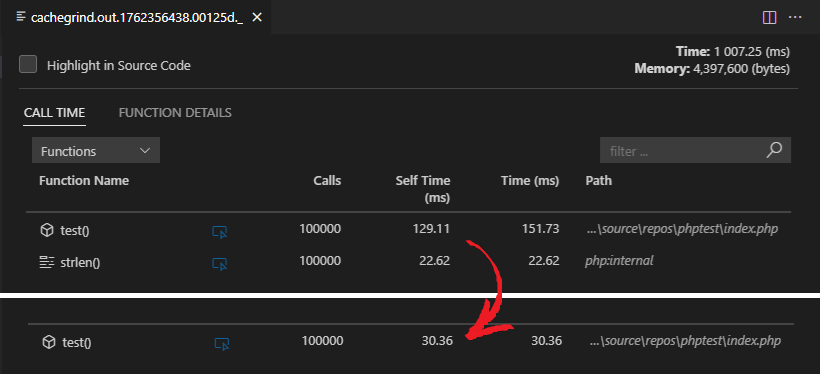
PHP has come a long way from being an interpreted scripting language for home web pages to a pretty fast object-oriented compiled language running the most powerful websites on the Internet. As part of its performance boost are various compiler optimizations. In this blog post, we'll focus on a subtle feature that makes applications automatically faster (although just slightly): optimizing native function invocation.

optimize native function invocation

Run and Debug Pest and PHPUnit Tests in VS Code

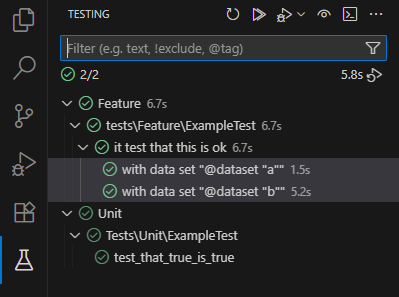
Test Explorer in Visual Studio Code opens the door to all your PHPUnit and Pest PHP tests. You can browse and filter test suites, test classes, test cases, and data sets. Run, debug, profile, or navigate to any test. You can enable automatic testing on changes, browse test history, and see detailed diffs of actual and expected results. Let me show you how.

test explorer

Vibe Coding getting smarter with PHP diagnostics

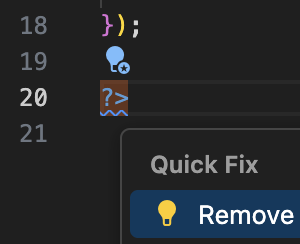
PHP Extension works seamlessly with Cursor—the popular AI-powered code editor. With the PHP extension, you get a full suite of features, including code completion, intelligent code actions, an integrated debugger, advanced syntax highlighting, and effortless navigation. But that’s not all! It also offers workspace-wide code analysis and detailed diagnostics. Plus, these features are fully compatible with the AI chat agent, creating a powerful coding experience.

Profile Laravel in Visual Studio Code

Cover Image

Performance always matters. Your Laravel application might be beautifully designed and written, but there's always the possibility of hidden bottlenecks. Is it unnecessarily slow? Can it be optimized further? Sometimes, a single function can consume most of your CPU time. In this tutorial, you'll learn how to profile your Laravel application in Visual Studio Code to uncover and address these issues.