Manual PHP installation with debugging support in VSCode on Windows#
Setting up PHP manually on Windows may sound intimidating at first, especially when there are many ready-made bundles and installers available. Those solutions can certainly be convenient, but they often hide important details about how PHP actually works.
In this guide, we will go through a clean manual installation of PHP on Windows, configure debugging support with Xdebug, and connect everything to Visual Studio Code using PHP Tools for Visual Studio Code.
The advantage of this approach is reliability and understanding. Once completed, you will know exactly how your PHP environment is configured, how debugging works, and how the individual pieces communicate together.
Downloading PHP#
We’ll start by downloading PHP itself.
Open the official PHP downloads page:
https://www.php.net/downloads.php
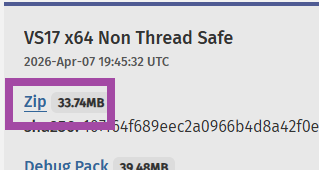
Look for the latest Windows ZIP package named: VS17 x64 Non Thread Safe.
The important parts are:
- VS17 — built using Visual Studio 2022 toolchain
- x64 — 64-bit build
- Non Thread Safe (NTS) — recommended for most modern development setups, including FastCGI and debugging
Installing the Visual C++ Runtime#
Because the PHP package is compiled with the Visual Studio 2022, Windows also needs the corresponding Visual C++ runtime installed.
Most people are not sure whether they already have it installed, so the easiest approach is simply searching for vc redist 140 x64 and installing it.
Navigate to the Microsoft's download page - Visual C++ Runtime - and download and install the official Microsoft Visual C++ Redistributable package. This runtime is required for PHP to start correctly, and you can safely install it even if you already have it.
Extracting PHP#
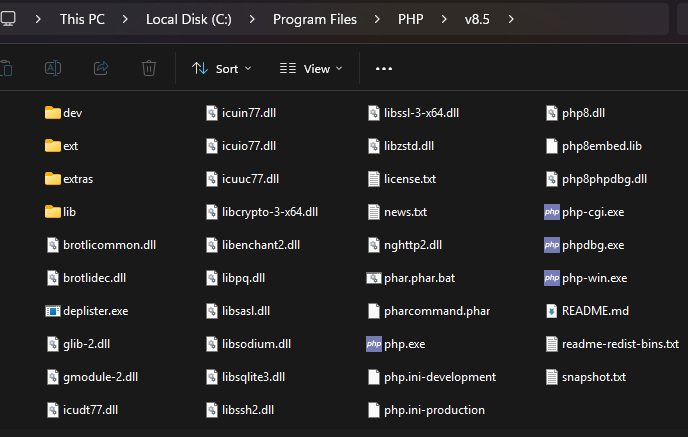
Once PHP is downloaded, extract the ZIP archive into: C:\Program Files\PHP or a sub-folder with your PHP version if you prefer.
You can technically place PHP anywhere, but keeping it inside Program Files is a clean and conventional choice.
After extraction, the folder should contain files such as:
Adding PHP to the PATH Environment Variable#
This step is optional, but recommended.
Adding PHP to the system PATH allows you to run commands like:
from any terminal window.
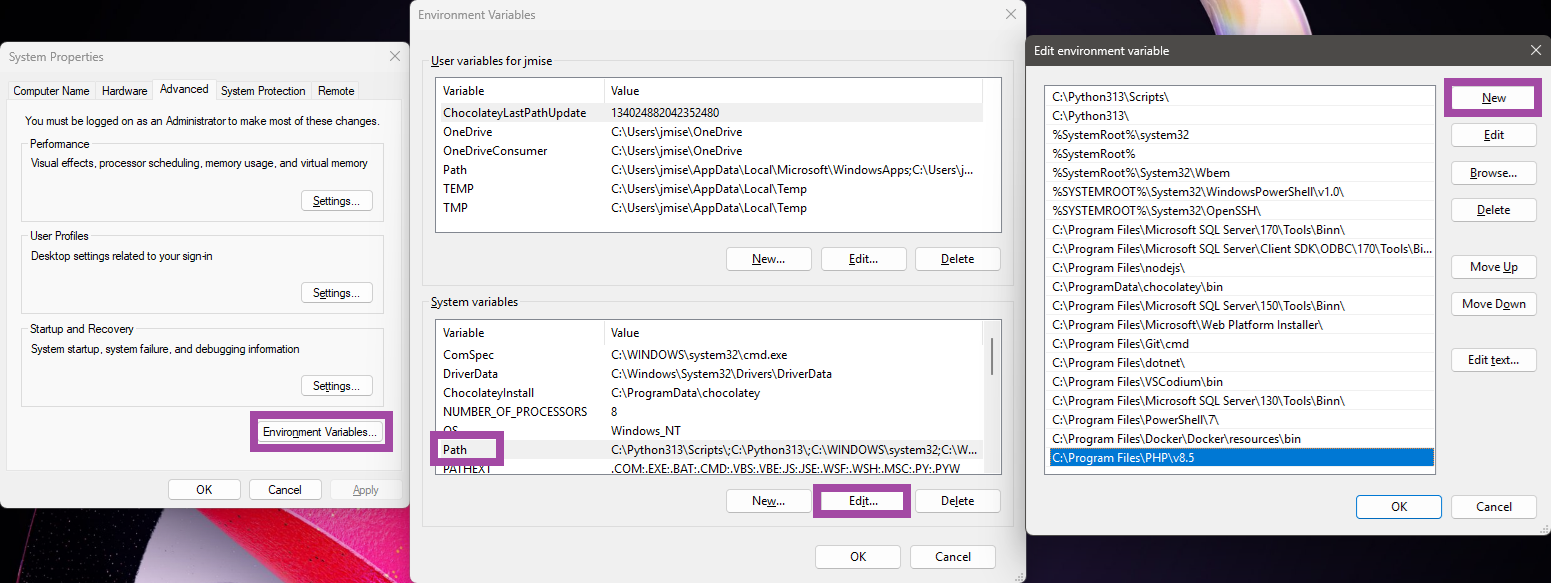
To do this:
- Open System Environment Variables
- Edit the
PATHvariable - Add:
- Make sure, there is not another path to another installation of PHP.
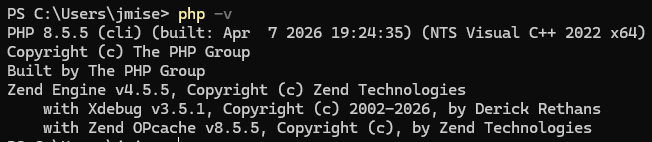
After saving the changes, open a new terminal and verify the installation:
Installing Xdebug#
Next, we’ll enable debugging and profiling using Xdebug.
Go to:
Download the version matching:
- your PHP version
- x64 architecture
- not
TSbuild.
Then copy the downloaded .dll file into the ext sub-folder inside your PHP installation:
Creating php.ini#
Inside your PHP folder, locate:
Rename it to:
The development configuration already contains sensible defaults suitable for local development.
Enabling Common PHP Extensions#
Open php.ini in a text editor.
Search for lines starting with:
The semicolon means the line is commented out.
Uncomment the extensions you need by removing the semicolon.
Commonly enabled extensions include:
The exact list depends on your actual requirements.
Enabling Xdebug#
Scroll to the end of php.ini and add the following line:
Replace the filename with the actual Xdebug DLL you downloaded.
Important details:
- use the full absolute path
- keep the path inside double quotes
- use
zend_extension, notextension
Example:
At this point, PHP will load Xdebug every time it starts.
Additional Xdebug settings can be configured manually in this file, but when using VS Code together with PHP Tools, much of the debugging configuration is handled automatically.
You can verify everything works by opening a terminal and running:
You should see both PHP and Xdebug listed.
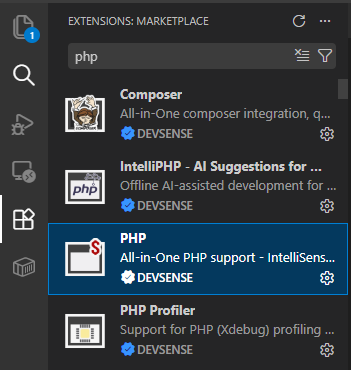
Installing PHP Tools in Visual Studio Code#
Now switch to Visual Studio Code.
Open the Extensions panel and install:
PHP by DEVSENSE
This extension provides:
- IntelliSense
- code analysis
- debugging support
- profiling support
- navigation
- refactoring
- test explorer and code coverage
- and many other PHP development features
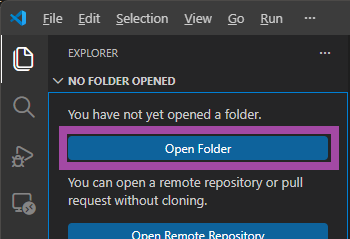
Opening Your Project#
Open your PHP project folder in VS Code.
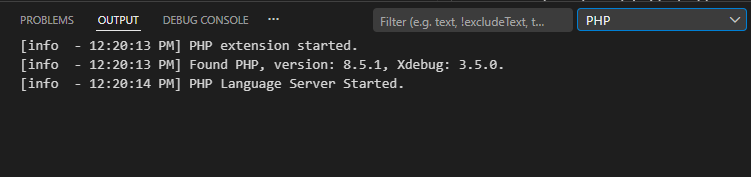
At this point, after opening a .php file, the extension should automatically recognize your PHP installation and initialize the workspace.
You can verify that PHP was correctly configured in the VSCode's OUTPUT window, tab PHP:
Starting Debugging#
To start debugging you have two options:
- Open any
.phpfile and hitF5(Quick Launch).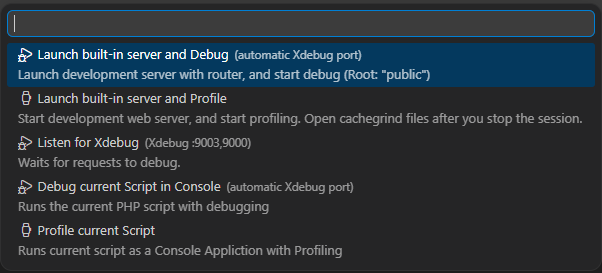
- Or create a proper launch configuration in VSCode's Run and Debug panel.
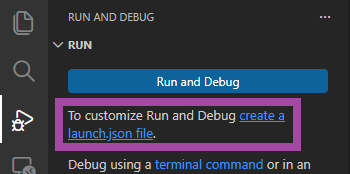
Depending on your project type, there are multiple launch profiles available. For advanced scenarios, refer to the official documentation.
Please see launch.json for launch profiles where you can customize how to run and debug your project, or do the performance profiling.
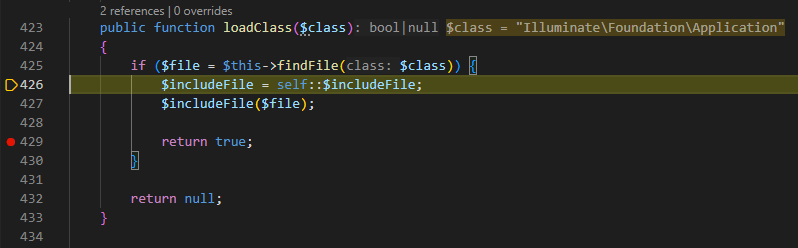
How Debugging Works#
Behind the scenes, PHP Tools communicates with PHP runtime while PHP script is running.
This allows your IDE to:
- stop execution on breakpoints
- inspect variables
- step through code line by line
- evaluate expressions
- analyze call stacks
Instead of relying on echo or var_dump, you gain a fully interactive debugging experience directly inside the editor.
Conclusion#
You now have a complete PHP development setup on Windows with debugging support configured manually from scratch.
This setup is ideal for local development because it gives you full visibility and control over your PHP environment while avoiding hidden configuration performed by third-party bundles.